
Gatling是基于Scala、Akka和Netty的开源负载和性能测试框架
Why Gatling
- 强大到没有边际的DSL
- 使用Akka Actors,并发测试性能高
- 写代码的方式测试,对程序员友好,当然,这也导致有一定的学习成本
- 虽然Gatling是用scala写的,如果你只是使用的话,根本不需要了解scala
- 测试结果稳定(相对我之前用过的几个小工具)
- 扩展性强(可用来测udp、rpc等)
- 漂亮的测试报告、丰富的文档……
安装
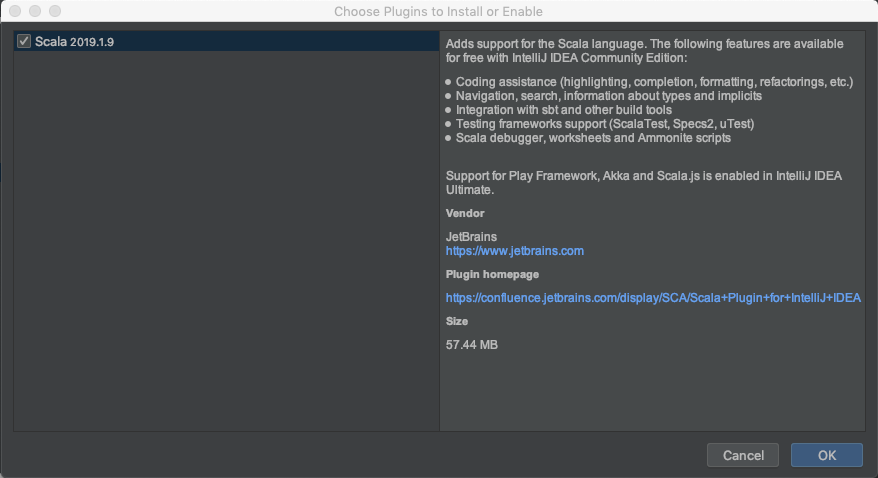
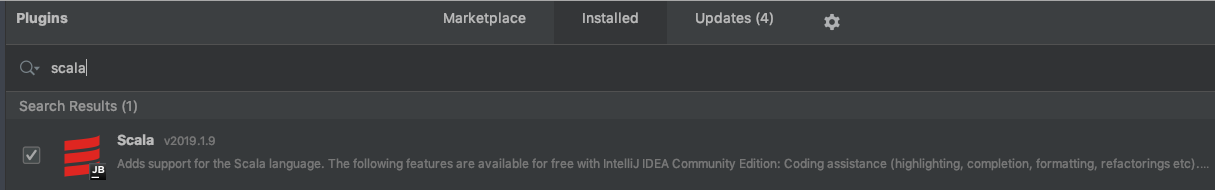
安装scala插件
安装scala sdk
IDEA

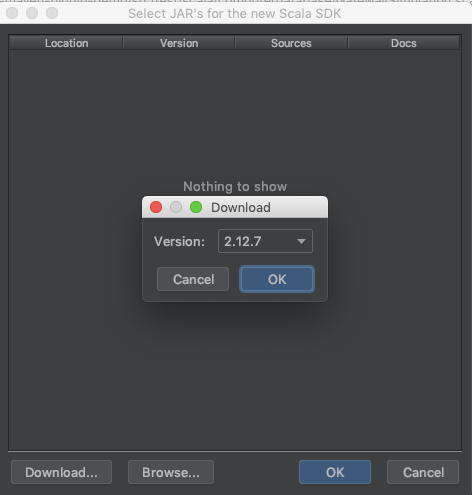
手动安装
idea下载的时候总是卡住不动,于是我选择手动下载的方式
下载scala-2.12.7,解压后移动到/usr/local/share/
设置环境变量
1
2
| export SCALA_HOME="/usr/local/share/scala-2.12.7"
export PATH="/usr/local/opt/python@3.8/bin:$SCALA_HOME/bin/:$PATH"
|
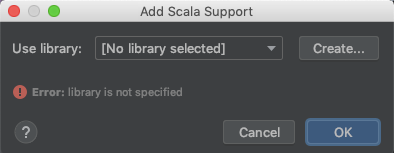
再到IDEA里进行关联
Demo sample
官方有一个maven-plugin的demo
gatling/gatling-maven-plugin-demo
下载下来,基于它进行改造,编写自己的测试用例
项目结构
1
2
3
4
5
6
7
8
9
10
11
12
13
14
15
16
17
18
| gatling-maven-plugin-demo
├── README.md
├── pom.xml
└── src
└── test
├── resources
│ ├── data
│ │ ├── t_instance.csv
│ │ └── t_instance_port.csv
│ ├── gatling.conf
│ └── logback-test.xml
└── scala
├── Engine.scala
├── IDEPathHelper.scala
├── Recorder.scala
└── computerdatabase
├── ServiceSimulation.scala
└── InstanceSimulation.scala
|
使用
一个实例
5秒钟发起100个GET请求
即每秒钟20个请求
1
2
3
4
5
6
7
8
9
10
11
12
| class InstanceSimulation extends Simulation {
val httpProtocol = http.baseUrl("http://127.0.0.1:8080")
val headers_json = Map("Content-Type"->"application/json")
val scn = scenario("instanceList")
.exec(http("instanceList")
.get("/service/instanceList")
.queryParam("serviceName", "test")
.headers(headers_json)
)
setUp(scn.inject(rampUsers(100) during(5)).protocols(httpProtocol))
}
|
粗点看的话,会发现这个实例分为Simulation、Scenario和setUp三部分
Simulation、Scenario和setUp
Simulation是一个单独的测试文件,Scenario是这个测试中的不同场景——不同的URL、不同的Method或者不同用户等等
每个Simulation都需要且只能有一个setUp方法,多个scenario可以以并串行的方式执行
注入用户
注入用户是在setUp阶段。
Gatling的虚拟用户是以消息来实现的,可以更好地扩展并轻松达到成千上万的并发
每个虚拟用户都有自己的数据与连接
- nothingFor(4) 4秒钟内什么也不做
- atOnceUsers(10) 一次性注入10个用户
- rampUsers(100) during (5) 5秒内均匀地注入100个用户 (rampUsers必须与during配合使用)
- rampUsersPerSec(10) to (100) during(60) 1分钟内,注入用户的速率由10个/s涨到100个/s
- rampUsersPerSec(10) to (100) during(60) randomized 跟上一个相当,在注入用户时加入了随机因子
- constantUsersPerSec(20) during(60) 20个用户/秒,持续60秒
- constantUsersPerSec(20) during(60) randomized 加入了随机因子
执行
执行测试
1
| mvn gatling:test -Dgatling.simulationClass=computerdatabase.InstanceSimulation
|
查看报告
验证返回的数据
对于HTTP请求,默认情况下,Gatling只会验证HTTP状态码。对于返回数据的验证,可以使用check方法。
如果数据格式是json,可以使用jsonPath来进行检测,比如检测返回的code是否为0:
1
2
3
| .exec(http("get_instance_list")
.get("/service/instanceList")
.headers(headers_json).check(jsonPath("$..code").is("0")))
|
再比如,判断返回的data数组长度不为0
1
| .check(jsonPath("$..data[*]").count.gt(0)))
|
gatling的check支持非常丰富的验证方式(html、css、jsonp、jmes、xpath、regex等等),具体使用可以参考官方的单元测试
gatling/gatling
Debug
打印session
1
2
3
4
| .exec(session => {
println(session)
session
})
|
可以简写为:
1
2
3
4
| .exec{session =>
println(session)
session
}
|
加上debug后的scenario
1
2
3
4
5
6
7
8
9
10
11
12
| val scn = scenario("instanceList")
.feed(jsonFileFeeder)
.exec(session => {
    println(session)
    session
})
.exec(http("group_send")
.get("/service/instanceList")
.queryParam("extendedMFWParams", "%7b%7d")
.queryParam("serviceType", "${service_type}")
.queryParam("serviceName", "${service_name}")
.headers(headers_json))
|
输出HTTP请求(Logback)
1
| <logger name="io.gatling.http.engine.response" level="DEBUG" />
|
- DEBUG—把记录所有失败的HTTP请求
- TRACE—记录所有HTTP请求
Session
对于Gatling来说,每个虚拟用户都有一个Session,这个Session就是Scenario中的实际消息,开发/测试人员可以捕获并处理存储在其中的数据
在Debug中看到了怎么打印的例子,这里再看一下如何把数据写入其中
修改Session
1
2
3
4
5
6
7
8
9
10
11
12
13
14
| .exec(session => {
session.set("instance_id", "338614-dubbosingleservicedemo-msp-7c8c8cf78f-8rv7k")
.set("status", "3")
})
.exec(
http("addInstance")
.post("/instance/add")
.headers(headers_json)
.body(StringBody(
"""{
|"instanceId":"${instance_id}",
|"status":"${status}"
|}""".stripMargin)).asJson
)
|
Feeder
Feeder主要用来注入动态变量和参数
比如我想用数据表里的数据来做压测,就把数据导出(json或csv,其他都行,直接用jdbc feeder也行)
JSON Feeder
1
2
3
4
5
6
7
| val jsonFileFeeder = jsonFile("data/online_provider.json").random
val scn = scenario("instanceList")
.feed(jsonFileFeeder)
.exec(http("group_send")
.get("/service/instanceList")
.queryParam("serviceName", "${service_name}")
.headers(headers_json))
|
随机数
由于DSL预编译导致Random无效,也需要用Feeder来解决
1
2
3
4
5
6
7
8
9
10
11
12
| val ports = Iterator.continually(
Map("random_port" -> Random.nextInt(1000000))
)
val scn = scenario("instanceList")
.feed(jsonFileFeeder)
.feed(ports)
.exec(http("group_send")
.get("/service/instanceList")
.queryParam("serviceName", "${service_name}")
.queryParam("port", "${random_port}")
.headers(headers_json))
|
“关联”Feeder
我在测试的时候由于是导出数据表的方式,有的请求会涉及到两个表——这时候就需要关联两个表的数据,官方有一个例子,照着改一下就行了
1
2
3
4
5
6
7
8
9
10
11
12
| val instanceFeeder = csv("data/t_instance.csv").random
val portsByInstance: Map[String, Seq[Record[Any]]] =
csv("data/t_instance_port.csv").readRecords.groupBy { record => record("instance_id").toString }
val addScn = scenario("addInstance")
.feed(instanceFeeder)
.exec{session =>
session("instance_id").validate[String].map{instance =>
val portsOfInstance = portsByInstance(instance)
val selectedPort = portsOfInstance(ThreadLocalRandom.current.nextInt(portsOfInstance.length))
session.set("port", selectedPort("port"))
.set("port_protocol", selectedPort("protocol"))
}
|
报告
最后,拿一个真实的例子看下测试报告吧
1
2
3
4
5
6
7
8
9
| rampUsers(12000) during(60),
rampUsers(18000) during(60),
rampUsers(24000) during(60),
rampUsers(30000) during(60),
rampUsers(36000) during(60),
rampUsers(42000) during(60),
rampUsers(48000) during(60),
rampUsers(54000) during(60),
rampUsers(60000) during(60),
|
并发用户数从200压到1000(每60s增加100)
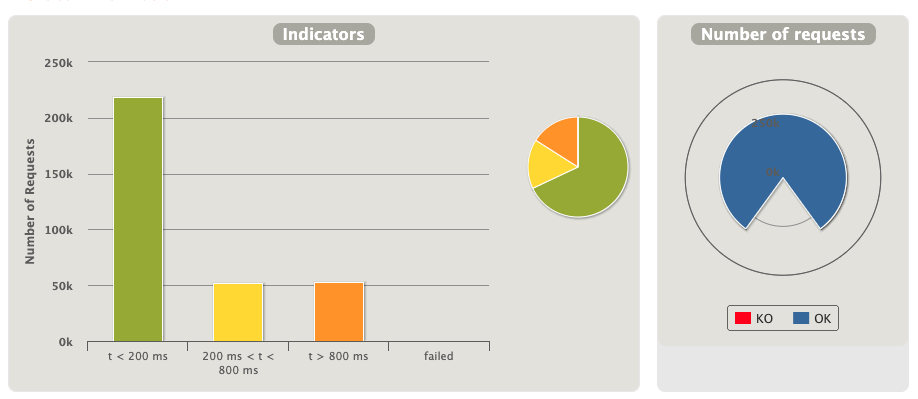
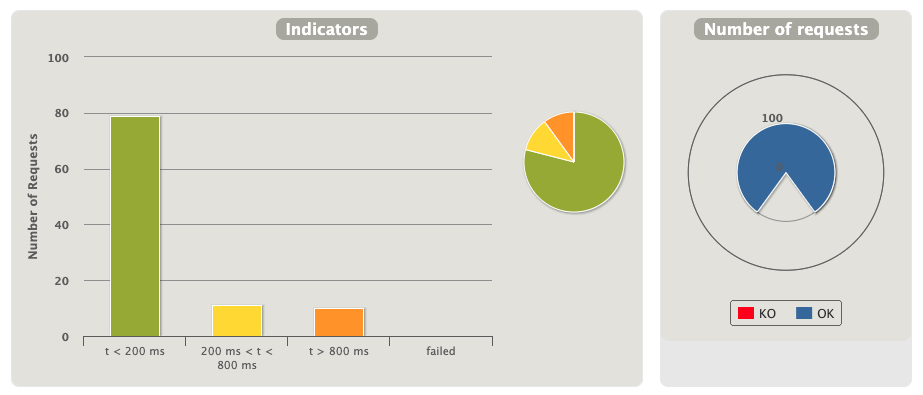
最上面的仪表盘记录的请求成功(OK)/失败(KO)信息,以及请求响应时间分布
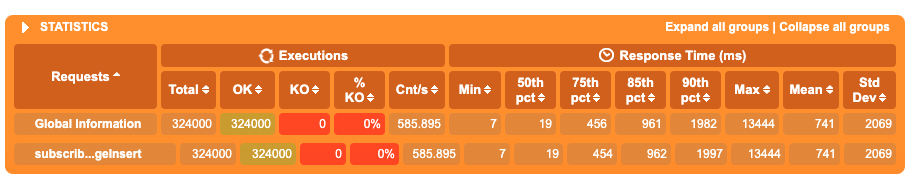
这里面主要是响应时间的分位数,比如85线是962ms
响应时间和分位数可以通过gatling.conf中的charting.indicators配置
1
2
3
4
5
6
7
8
9
10
11
12
| charting {
indicators {
lowerBound = 200
higherBound = 800
percentile1 = 50
percentile2 = 75
percentile3 = 85
percentile4 = 90
percentile5 = 95
percentile6 = 99
}
}
|
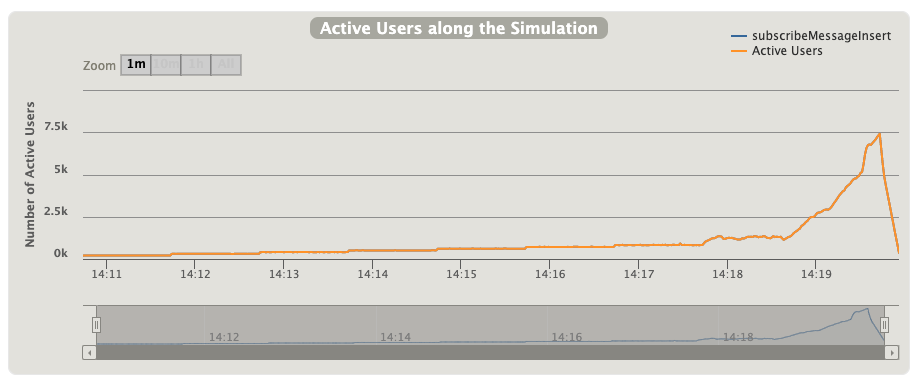
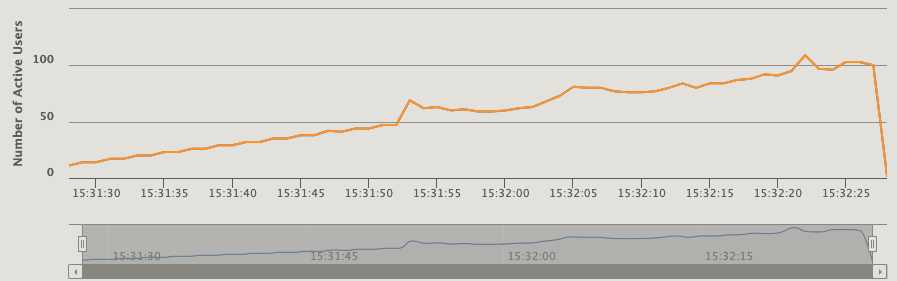
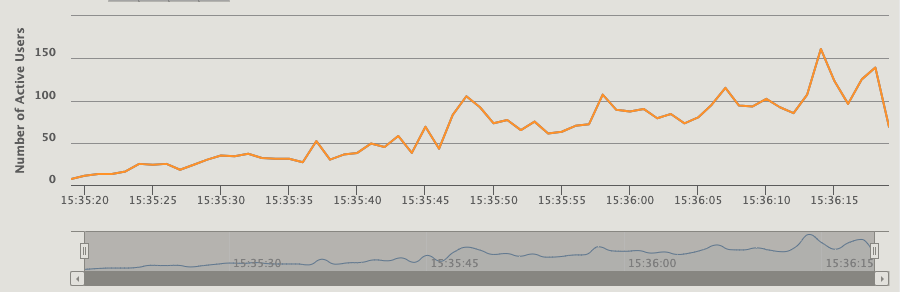
活跃用户数,如果某个时间点的用户在1s内没有收到响应,就会积压到下一秒的活跃用户中
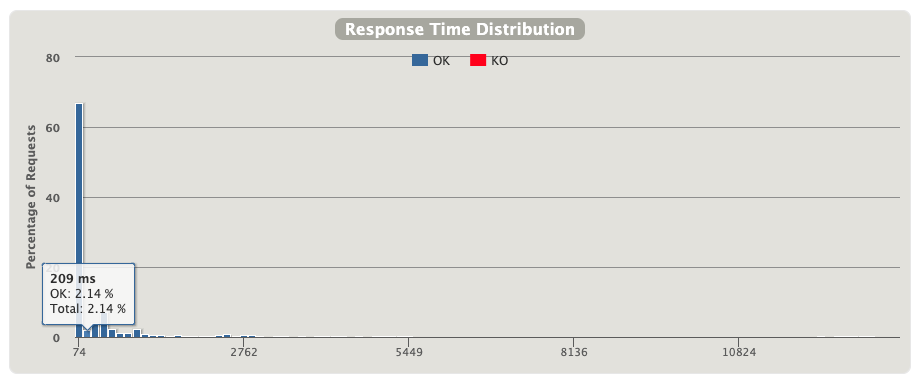
响应时间的分布,这个更详细一些
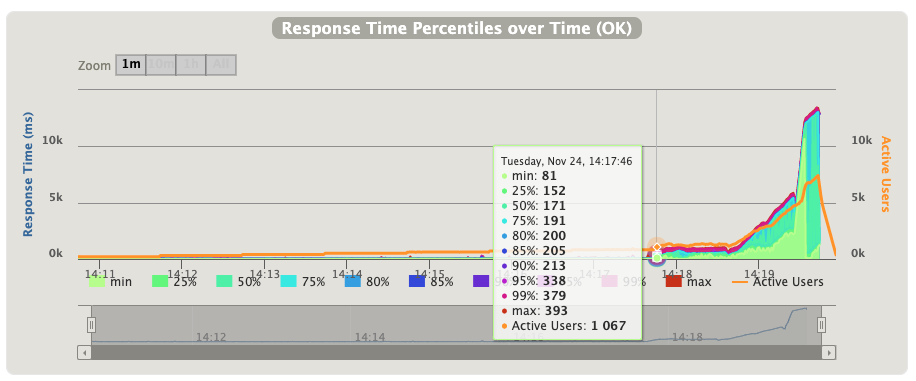
每个时间点的响应时间分位数,可以看到活跃用户是1067时,90%的响应时间在213秒内
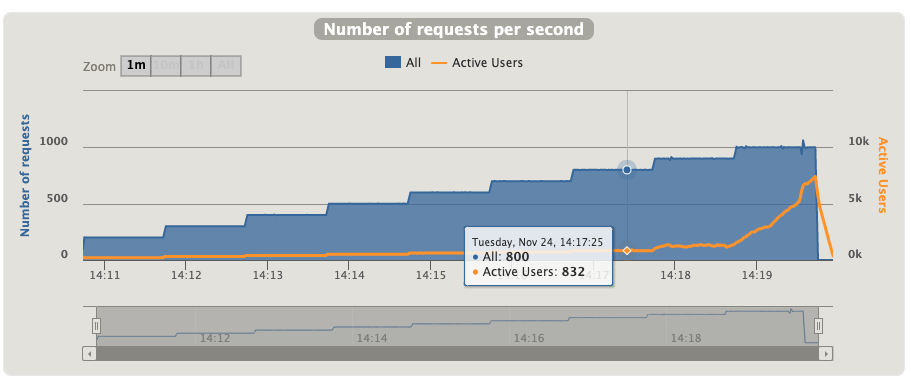
这个图能更直观地看到从哪开始出现在了积压
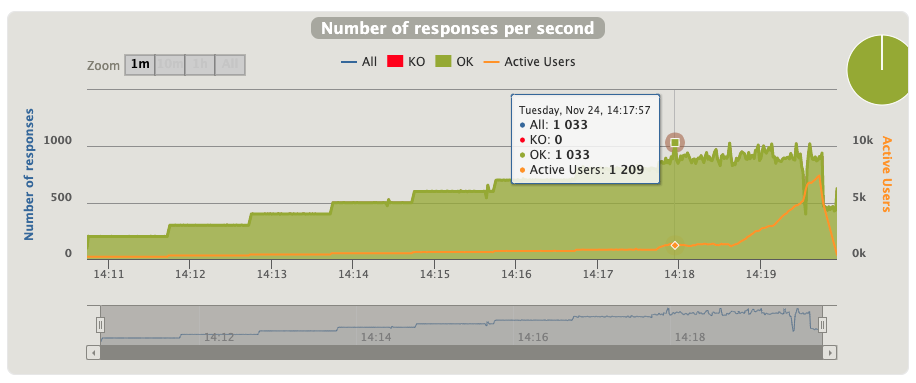
每秒响应请求数,即TPS
后记
本文只是我接触并使用Gatling短短两三天的一个总结,如有写的不好的地方,还请指出。
参考